App Store Analytics: What to Measure Before & After Launch (ASO + Conversion)
- Andrew Applebaum

- Mar 5
- 4 min read

You’ve spent months curating the perfect stories for your town, but now you’re sitting in a board meeting staring at a spreadsheet and wondering if anyone is actually seeing them. It’s a bit like throwing a great party in a hidden courtyard; if people can’t find the entrance, they can’t enjoy the music (and you’re left with a lot of leftover snacks).
The struggle is real for BIA managers and DMO marketing teams who need to prove that digital investments are actually driving foot traffic. We often get caught up in "vanity metrics" like total downloads, but those don't tell the whole story of how a visitor is interacting with your streets and shops. Understanding app store analytics is the key to turning a quiet launch into a bustling digital gateway for your destination.
What are the most important app store analytics to track for tourism?
The most critical metrics for a self-guided tour app are App Store Optimization (ASO) keywords, conversion rates from "view to download," and active user engagement. Instead of just looking at how many people downloaded the app, you should measure how many people are actually clicking on specific points of interest (POIs) once they arrive.
Setting the Stage: Pre-Launch ASO
Before you even hit "publish," you need to think about discoverability. App Store Optimization (ASO) is essentially SEO for the app world. If you’re a BIA in a town known for its murals, your keywords should reflect that. Are people searching for "walking tours," "local history," or "hidden gems"?
You want to make sure your screenshots look inviting. Think of them as your digital storefront. A good pro tip is to use images that show people actually using the app in your local parks or downtown core. It helps potential visitors visualize the immersive travel experience before they even click "get."
Post-Launch: Measuring Real-World Impact
Once you’re live, the real fun begins. This is where we move from "did they download it?" to "what did they do?" I remember working with a small region that was convinced their hiking trails were the main draw. After looking at their app store analytics and engagement data on the digital tourism platform, we realized people were actually spending way more time on the "historic bakeries" list. We shifted the marketing focus, and engagement skyrocketed.
Data-driven decisions allow you to stop guessing and start supporting the shop local movements that are actually catching the eye of your visitors.
Metric Type | What it Tells You | Why it Matters for BIAs/DMOs |
Search Impressions | How many times your app appeared in search results. | Measures your brand awareness and ASO health. |
Conversion Rate | The % of people who saw your app and downloaded it. | Tells you if your photos are actually appealing. |
POI Views | How many times a specific business was viewed. | Direct proof of value for your local business members. |
Session Length | How long a visitor stays active in the app. | Indicates if your content is "sticky" and interesting. |
Case Study: The Town of Riverview "Business Bee"
If you want to see the power of tracking the right numbers, look at the Town of Riverview. They launched a seasonal "Business Bee" Scavenger Hunt to highlight local shops. By keeping a close eye on their engagement analytics, they saw 4,087 POI views during the campaign period.
The coolest part? July alone generated 2,335 views. Nearly 50% of all their digital engagement came directly from that single scavenger hunt. Because they could measure that specific "spike," they proved to their council that gamification wasn't just a "nice to have," it was a primary driver of foot traffic. This kind of cultural tourism data makes your year-end reporting much easier.
Key Takeaway: Analytics are your best friend for reporting. When a local shop owner asks why they should care about your digital tour, you can show them exactly how many "digital door swings" you delivered to their specific location.
FAQ: Navigating Your Data
Q: How do I know if my App Store Optimization is working?
A: Check your "Search Impressions" in the App Store Connect or Google Play Console. If those numbers are climbing but your downloads are flat, your keywords are good, but your screenshots or description might need a "warm-up" to be more inviting.
Q: Is a high download count the best sign of success?
A: Not necessarily. For a local BIA, 500 downloads from people actually walking your streets is much more valuable than 5,000 downloads from people who never visit. Focus on "Active Users" and "POI Interactions" to see real economic impact.
Q: What's the best way to create a self-guided tour app for a small town?
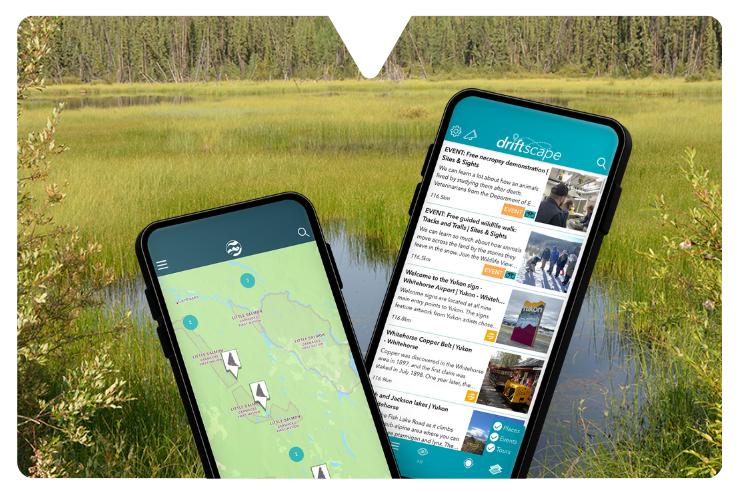
A: The best way is to start with a platform like Driftscape that offers built-in analytics so you don't have to build a dashboard from scratch. Focus on one high-quality "anchor" tour (for example a scavenger hunt) and use that data to decide what to build next.
Measuring your success shouldn't feel like a math homework assignment. It’s about understanding your visitors so you can give them more of what they love. If you’re curious about how your current town highlights are performing, take a look at your top-viewed POIs this month. You might be surprised by what you find!


Comments