7 Quick Wins to Get More Out of Your Tourism App Analytics This Summer
- Andrew Applebaum

- Jun 17, 2025
- 5 min read
Updated: Mar 4

Ever feel like your tourism app isn't quite living up to its potential? You've invested in a fantastic tool to enhance visitor experiences and showcase your destination's unique charm, but the data isn't showing the growth you expected. With limited time and tight budgets, it can be tough to move the needle on your app analytics. What if you could significantly boost engagement and visibility with just a few hours of focused effort?
Good news: you absolutely can. As a fellow destination pro, I've seen firsthand how a few strategic, low-cost actions make a big difference in how visitors interact with your brand. This summer, let’s unlock your platform’s power with quick, actionable steps you can realistically implement in a single afternoon. No coding, no fancy setup; just smart tweaks that lead to measurable growth in your app analytics dashboard.
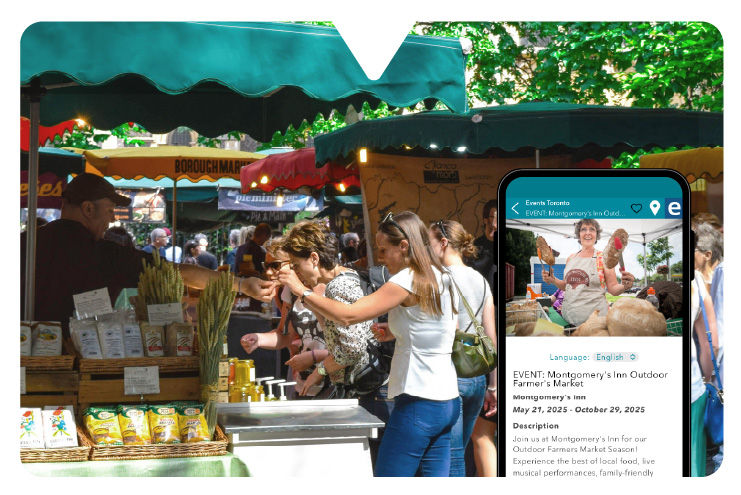
1. Refresh Your App Photos for a Stellar First Impression
Think of your app’s visuals as your digital storefront. Outdated or low-quality photos can be a major turn-off, and you only get one chance to make that initial visual hook.
Specific Impact: Fresh, inviting imagery can increase click-throughs to tour stops by an estimated 10–15%.
Implementation Ease: Very easy. A few hours with a smartphone can yield fantastic results. Focus on capturing the experience; show people enjoying themselves, tasting local food, or interacting with exhibits.
2. Print and Hang Engaging QR Code Posters
QR codes are your direct link from the physical world to your digital tours. Don't just print them; make them inviting with clear calls to action!
Specific Impact: Strategic placement can drive an estimated 20% increase in on-site app downloads and tour starts.
Implementation: On platforms like Driftscape, QR codes link directly to specific stops or tours. Print and place them where visitors naturally linger: windows, trailheads, or near the cash register.
Key Takeaway: Pair QR codes with hyper-local calls to action like "Scan to Discover Our Hidden Gems" or "Find Your Next Favourite Patio" for a perfect shop-local moment.
3. Update Your Google & Apple Maps Photos
Ensure consistency across all your digital touchpoints. If your app looks great, your map listings should too. These platforms often serve as the top of the funnel that directs traffic toward your app.
Specific Impact: Harmonizing visuals across platforms enhances brand consistency and can lead to a 5–10% uplift in search-to-app conversions.
Implementation: Update your Google Business Profile and Apple Maps Connect. High-quality images here ensure that your app analytics reflect a steady flow of interested users from organic search.
4. Use App Analytics to Empower Your Front-Line Staff
Your staff are your best advocates! A quick, genuine mention in a casual conversation can go a long way in encouraging app adoption.
Specific Impact: Staff recommendations can increase app adoption rates by an estimated 25% among direct interactions.
Implementation: Hold a 15-minute huddle to share key talking points. When staff see the "Total Scans" rise in your monthly reports, it reinforces the value of their efforts.
Pro Tip: Provide staff with a "hook" about the app, such as: "It’s like having a local guide in your pocket for discovering all our downtown murals!"
5. Add "Start Your Tour Here" Signs at Key Locations
Guide visitors to the perfect starting point for their adventure. Reducing friction is the fastest way to improve your completion rate data.
Specific Impact: Clear directional signage can reduce friction for new users, potentially increasing tour starts by 15% in high-traffic areas like historical walking trails.
Implementation: Combine a simple sign design with your QR code. Organizations like Destination Canada emphasize the importance of seamless visitor journeys; clear signage is the physical version of that journey.
6. Embed Tour Links in All Your Communications
Make it effortless for people to find your app wherever they interact with you digitally. It’s about meeting them where they are.
Specific Impact: Consistent linking in digital communications can subtly boost app engagement by 5–8% across your online presence.
Implementation: Add your tour link to your email signature, hotel guest welcome emails, and monthly newsletters.
If You Only Have 10 Minutes: Update your email footer and social media bios right now to see an immediate boost in your app analytics referrals.
7. Build a Short "5-Minute Highlights" Loop
Sometimes, visitors just want a taste. Offer them a quick, digestible experience that hooks them and leaves them wanting more.
Specific Impact: Short mini-tours often see a 30% higher completion rate. This is fantastic for fostering cultural tourism without overwhelming newcomers. For example, Evergreen Brickworks created a successful "5-Stop Community" tour.
Implementation: Curate 3–5 key stops that flow well. On a digital tourism platform like Driftscape, you can easily reorder existing stops to create new, compelling content.
Strategy | Estimated Engagement Lift | Effort Level |
Visual Refresh | 10-15% | Low |
QR Code Placement | 20% | Low |
Staff Advocacy | 25% | Medium |
Mini-Tour Loop | 30% | Medium |
Summary Checklist for Your Summer Success
[ ] Add your tourism app link to your email signature.
[ ] Post your app download link to your social media bios.
[ ] Refresh at least three photos for your top-performing stops.
[ ] Briefly chat with front-line staff about promoting the app.
[ ] Review your latest app analytics dashboard to set a baseline.
These quick wins demonstrate that getting more out of your app analytics doesn't require a massive overhaul. It’s about consistent, smart actions that make it easier for visitors to engage with your incredible offerings.
Frequently Asked Questions
Q: How can I track my app analytics?
A: You can track engagement through a dedicated partner dashboard, like the one provided by Driftscape. This allows you to see real-time data on tour starts, stop views, and user demographics to help you make informed marketing decisions.
Q: Why is my app engagement low during peak season?
A: Low engagement often stems from a lack of physical "hooks." If visitors don't see signage or QR codes at the point of interest, they may not realize a digital tour is available. Improving on-site visibility is the fastest way to fix this.
Q: What is a good completion rate for a mobile tour?
A: While it varies by destination, a completion rate of 20–30% is considered strong for long tours. For "Mini-Tours" or "Highlight Loops," you should aim for 50% or higher, as shorter content is easier for visitors to finish.
Q: Do QR codes actually improve app analytics?
A: Yes. QR codes bridge the gap between physical exploration and digital content. By placing them at high-traffic stops, you can see a direct correlation in your analytics between physical foot traffic and digital app sessions.
Q: How often should I update my app content?
A: At a minimum, you should refresh your imagery and check your links seasonally. Fresh photos for summer and winter ensure that the app feels relevant and "live" to visitors, which encourages higher engagement scores.
Q: How do I use data to improve my visitor experience?
A: By reviewing which stops have the highest "drop-off" rates, you can identify where content might be too long or unengaging. Use these insights to edit your scripts or add more exciting visuals to keep visitors moving through the tour.
Q: Can app analytics help with grant applications?
A: Absolutely. Hard data on visitor engagement, popular locations, and user growth provides powerful evidence of impact, making it much easier for DMOs and non-profits to secure funding for future tourism projects.


Comments